Digital Filtering Project Description
As a basic application of digital filtering you are asked to apply a 7 day-moving average filter to the latest data update on the daily count of COVID19 in New York: a) cases, b) hospitalization and c) deaths due to the Corona virus.
Note: Use this document to fill in the blanks and include all the necessary information. Include a copy of this original document in the appendix of your technical report for the project.
Obtain the latest daily data from:
https://www1.nyc.gov/site/doh/covid/covid-19-data.page#download
or from COVID-19: Data Main - NYC Health
Important: If you cannot find new, updated data from the beginning of the pandemic to the present use the old data sets from SP20 which are provided in the Project folder.Using old data sets may carry some slight penalty.
MissingValues:Possible approach for missing values: Substitute “null” values for zero if they appear at the beginning or the end of the data, otherwise substitute for the average of its previous and next value or any other technique that you want (Justify).
Plots
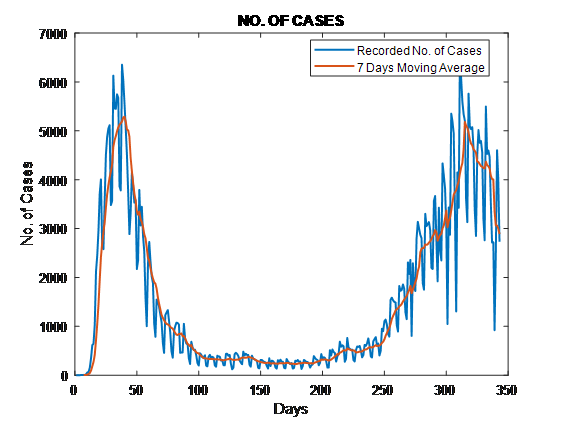
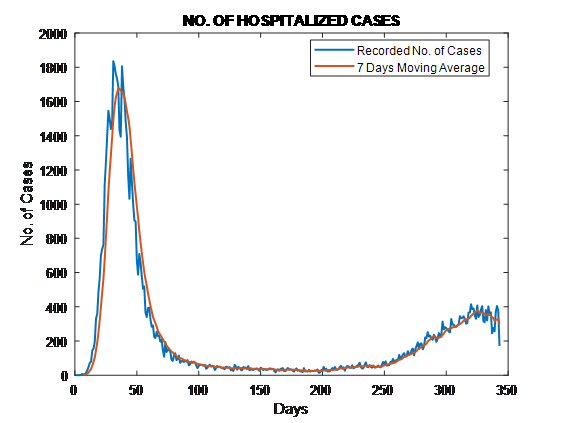
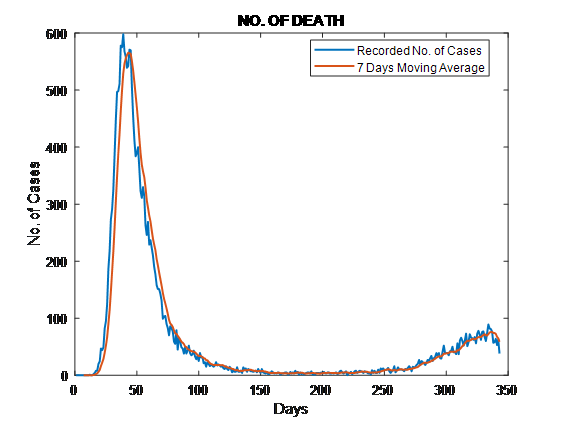
The smooth 7-day moving average curves should appear in a different colors superimposed to a bar chart with the latest update regarding the daily number of a)cases, b)hospitalizations and c)deaths. Therefore a minimum of three plots (categories a, b, c), each with two superimposed traces, are required. All plots axis should be appropriately labeled including title and legend for each plot trace.
The following MATLAB code, read the data, pre-process, calculates the 7-day moving average and plot them; line plot is used instead of bar chart, since it provides better insight of the data.
% main
clear, clc, close('all')
%% read the data
[x, dit] = xlsread('data-by-day.csv');
n = size(x, 1); % number of samples
dts = dit(2:end, 1);% dates
tags = {'NO. OF CASES', 'NO. OF HOSPITALIZED CASES', 'NO. OF DEATH'};
%% calculate 7-day moving average
N = 7;
y = zeros(n, 3); y(1 : N - 1, :) = NaN;
for k = 1 : 3
for k1 = 1 : n - (N - 1)
k2 = k1 + (N - 1);
y(k2, k) = sum(x(k1 : k2, k))/N;
end
end
%% graphs
for k = 1 : 3
figure
plot(1:n, x(:, k), 1:n, y(:,k), 'Linewidth',1.5)
title(tags{k})
xlabel('Days')
ylabel('No. of Cases')
legend('Recorded No. of Cases', '7 Days Moving Average')
end
Output Graphs
For your filter provide the required answers or plots:
Unit sample response for your filter as a sum of delayed unit samples:
H7ma[n] =1/7 ∑_(i=1)^7▒〖δ[n-i-1]= {■(1/7&0≤n<7@0&otherwise)┤ 〗
Transfer Function including R.O.C for your filter.
H7ma[z] =∑_(i=0)^∞▒〖H_7ma [n] z^(-n)=〗 ∑_(i=1)^7▒〖1/7 z^(-n+1) 〗=〖1-z〗^(-7)/(7〖(1-z〗^(-1)))
R.O.C: |1/z|<1□(⇒┴ |z|>1)
Difference equation for your filter.
Y7ma[n] =1/7 ∑_(i=1)^7▒〖x[n-i-1]〗
Is this filter FIR or IIR. Answer: It is FIR filter, because it uses a finite number of samples to generate the output.
Is this filter stable? Answer: Yes, it is stable.
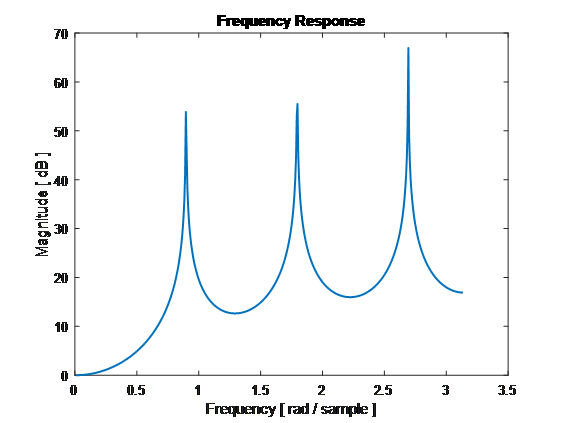
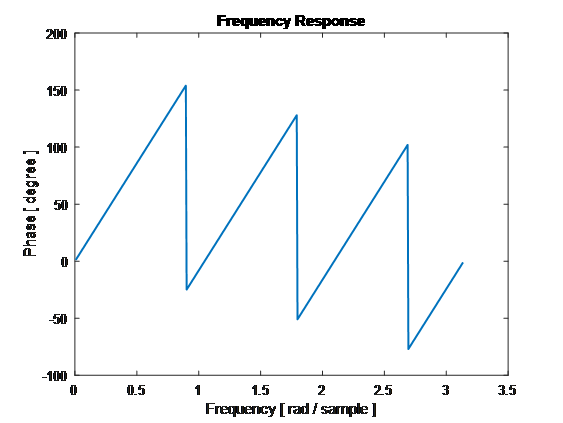
Magnitude Frequency Response
Use MATLAB to provide the Magnitude Frequency Response and Phase Frequency Response plots for your filter.
| [h,w ] = freqz(den,num); figure plot(w, 20*log10(abs(h)), 'Linewidth',1.5) title('Frequency Response') xlabel('Frequency [ rad / sample ]') ylabel('Magnitude [ dB ]') figure plot(w, angle(h)*180/pi, 'Linewidth',1.5) title('Frequency Response') xlabel('Frequency [ rad / sample ]') ylabel('Phase [ degree ]') |
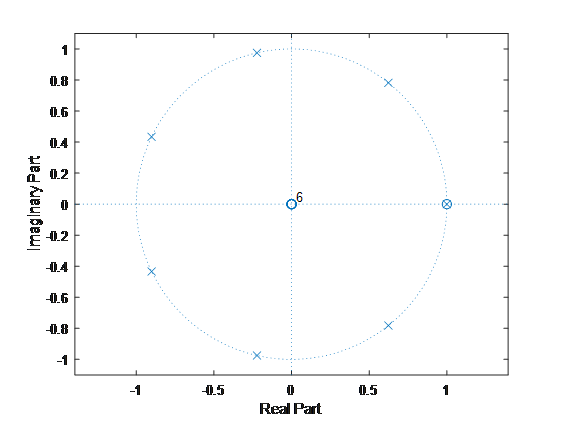
7) Use MATLAB to provide the Pole zero plot for your filter.
| num = [1 zeros(1,N-1) -1] den = N*[1 -1] zplane(num,den) |
8) Is this filterLow Pass Filters, High Pass Filter or Band Pass Filter? Answer: It is a Low Pass Filter, because averaging smooths out the signal, it, in fact, reduces the effects of high frequency components.
9) For this data give the sampling period in hours. Ts = 343*24/512 = 16 h, 4 min, 41 sec
Conclusions regarding the effect of applying these type of filters to the data
As it can be seenfromthegraphs, themovingaverageissmoothingthe curve and followstheoveralltrend of the curves. Howeveritmaylagsbehindthetrend and itmayalsodoesnotprovide a goodestimate at areaswithbigfluctuations (likeforexample at theendpart of “No. of Cases”).