How to Complete MATLAB Assignments Involving Data Analysis and Regression

MATLAB is a powerful tool for solving mathematical and engineering problems, particularly in data analysis, visualization, and statistical modeling. Many assignments require students to work with datasets, perform calculations, and generate visual representations to interpret data. A structured approach to solving these assignments ensures accuracy and efficiency. A common type of MATLAB assignment involves analyzing datasets, such as apartment prices based on size, to identify relationships between variables and make predictions. These assignments often include tasks like creating scatterplots to visualize data, calculating correlation coefficients to measure relationships, fitting regression models to predict outcomes, and interpreting statistical results. The first step to solve your data analysis assignment, is to understanding the dataset by importing and inspecting it in MATLAB. Data visualization, using scatterplots, helps identify patterns, while correlation analysis quantifies the strength of relationships. Regression modeling, typically using linear regression, allows for predictive analysis. The coefficient of determination (R2) helps assess model accuracy, and predictions can be made for new data points.

By following a systematic approach—importing data, visualizing relationships, performing statistical analysis, and interpreting results students can confidently complete their MATLAB assignment. Practicing with different datasets and utilizing MATLAB’s built-in functions enhances problem-solving skills and deepens understanding of data analysis techniques.
Understanding the Assignment Requirements
Before starting any MATLAB assignment, it is important to read and understand the problem statement carefully. Many assignments provide specific guidelines that must be followed, such as formatting requirements, labeling of graphs, and the inclusion of particular statistical measures. Ignoring these guidelines can lead to a loss of marks.
For instance, if an assignment requires you to analyze a dataset containing apartment prices and sizes, it is essential to recognize the objectives of the task. You may need to create a scatterplot to visualize the relationship between the variables, compute the correlation coefficient to quantify the strength of the relationship, fit a regression model to predict prices based on size, and interpret the results. Each of these steps involves specific MATLAB functions and techniques that must be applied correctly.
Importing and Exploring the Dataset
Most data analysis assignments in MATLAB require working with datasets stored in external files such as CSV (Comma-Separated Values) files. The first step is to import the data into MATLAB using functions like readtable or csvread. For example, if the dataset is stored in a file named "apartment_prices.csv," it can be imported using:
data = readtable('apartment_prices.csv');
Once the data is loaded, it is crucial to inspect its structure to understand the available variables and their formats. The head(data) function displays the first few rows of the dataset, helping to identify any missing values or inconsistencies. If necessary, data cleaning techniques such as removing missing values or converting data types should be applied before proceeding further.
Creating a Scatterplot for Visualization
Data visualization plays a crucial role in understanding relationships between variables. A scatterplot is an effective way to visualize how one variable changes concerning another. In MATLAB, scatterplots can be created using the scatter function. If the dataset contains two variables, SquareMeter (apartment size) and Price (apartment price), a scatterplot can be generated as follows:
scatter(data.SquareMeter, data.Price, 'filled');
xlabel('Apartment Size (Square Meters)');
ylabel('Price');
title('Scatterplot of Apartment Prices vs. Size');
grid on;
Interpreting the scatterplot is important for understanding the nature of the relationship between the two variables. A positive correlation implies that larger apartments tend to be more expensive, while a negative correlation would suggest the opposite. The direction, form, and strength of the relationship should be described based on the scatterplot's appearance.
Calculating the Correlation Coefficient
The correlation coefficient, denoted as RRR, quantifies the strength and direction of the relationship between two variables. In MATLAB, the corrcoef function can be used to calculate the correlation coefficient between SquareMeter and Price:
R = corrcoef(data.SquareMeter, data.Price);
correlation_coefficient = R(1,2);
The correlation coefficient ranges from -1 to 1. A value close to 1 indicates a strong positive correlation, meaning that as apartment size increases, the price also increases. A value close to -1 suggests a strong negative correlation, while a value near 0 implies little or no correlation.
It is essential to compare the computed correlation coefficient with the initial observations from the scatterplot. If the scatterplot suggested a positive relationship, the correlation coefficient should confirm this by yielding a positive value. If there is a discrepancy, it may indicate outliers or a nonlinear relationship that requires further investigation.
Fitting a Regression Model
Regression analysis is used to model the relationship between an independent variable (apartment size) and a dependent variable (price). In MATLAB, linear regression can be performed using the fitlm function, which fits a linear model to the data:
model = fitlm(data.SquareMeter, data.Price);
disp(model);
This command generates a regression equation of the form:
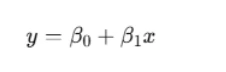
where y represents the predicted price, x represents apartment size, β0 is the intercept, and β1 is the slope. The slope β1 represents the rate at which price changes with each unit increase in apartment size.
Interpreting the slope is crucial. A positive slope indicates that larger apartments tend to be more expensive, while a negative slope (if obtained) would suggest that price decreases with increasing size, which may be unrealistic in most real-world scenarios.
Calculating the Coefficient of Determination (R2 )
The coefficient of determination, denoted as R2, measures how well the regression model explains the variation in the dependent variable. A higher R2 value indicates a better fit of the model to the data. The R2 value can be obtained directly from the regression model in MATLAB:
R_squared = model.Rsquared.Ordinary;
If R2 is close to 1, it means the regression model explains most of the variability in the data. A low R2 suggests that other factors influence apartment prices beyond size, and a simple linear regression model may not be sufficient.
Making Predictions Using the Regression Model
Once the regression model is fitted, it can be used to make predictions for new data points. For example, to predict the price of an apartment with a size of 68 square meters, the following MATLAB command can be used:
predicted_price = predict(model, 68);
Similarly, the price for an apartment of 31 square meters can be predicted in the same way. The ability to predict values for new data points is one of the most valuable aspects of regression analysis, as it allows for informed decision-making based on past data.
Conclusion
Solving MATLAB assignments that involve data analysis requires a structured approach. Understanding the problem statement, properly importing and cleaning data, visualizing relationships, computing statistical measures, fitting regression models, and interpreting results are all key steps. Additionally, following best practices such as labeling graphs, including legends, and using descriptive variable names enhances the readability and professionalism of the analysis. It is also important to cross-check results for consistency. If the scatterplot, correlation coefficient, and regression model suggest different interpretations, re-evaluating the data and analysis steps can help identify potential errors. Furthermore, understanding the limitations of a regression model is crucial. A simple linear regression model assumes a linear relationship between variables, but in some cases, more advanced techniques such as polynomial regression or multiple regression may be required to capture complex patterns. Students can enhance their MATLAB skills by practicing with different datasets and experimenting with various statistical models. Reading MATLAB documentation and using built-in functions effectively can significantly improve efficiency in solving assignments. By following a systematic approach, students can confidently tackle MATLAB assignments involving data analysis and regression, ensuring accurate and meaningful results. This guide serves as a general framework to solve your data regression assignment that involve similar types of analysis. By applying these principles, students can develop a deeper understanding of MATLAB and improve their ability to analyze real-world data effectively.