Estimating Total Hourly Solar Radiation at Inclined Surfaces Using Isotropic Model
Estimate the total hourly solar radiation at inclined surfaces for any location, given as input hourly total radiation and hourly diffuse radiation both at horizontal surfaces from TMY.
Test your code for the months of July and January, and for annual for New York City and San Juan.
MATLAB Code Graphs
Fig 1.
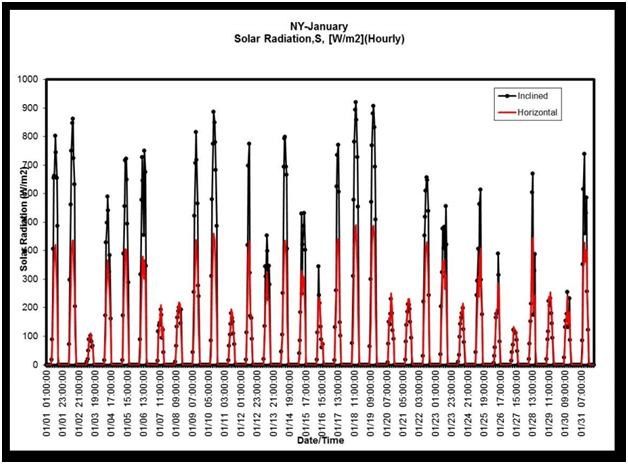
*Objective of MATLAB code is to produce a graph similar to Fig 1
*This is an example problem with given data
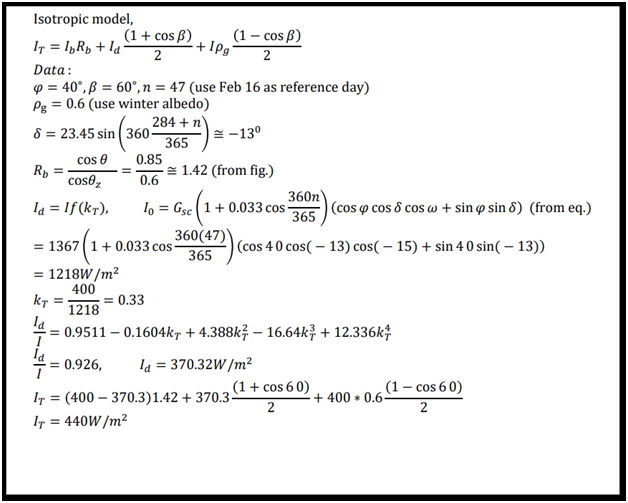
Estimate the total solar radiation that a surface receives when is located at 40 ° N latitude and inclined 60 ° for February between 11-12. The total horizontal hourly radiation is 400W/m 2. Use the Isotropic model.
MATLAB Script Solution
clc, clear all, close all
% Read file
data = readtable('1266523_40.81_-73.30_2019.csv');
N = size(data, 1);
phi = 40.81;
beta = -73.3;
pg = 0.6; % winter albedo
% omega = -15;
I_horizontal = 400; % W/m^2
Rb = 1.42;
omegaD = data.SolarZenithAngle;
%Calculate DHI and DNI per hour
DHI = zeros(N/2, 1); % inclined
DNI = zeros(N/2, 1); % horizontal
v = 1;
fori = 1:2:N-1
DHI(v) = sum(data.DHI(i:i+1));
DNI(v) = sum(data.DNI(i:i+1));
omega(v) = sum(omegaD(i:i+1))/2;
thetaz(v) = omega(v);
time{v} = sprintf("%d-%.02d-%.02d %.02d:00:00", data.Year(i), data.Month(i), data.Day(i), data.Hour(i));
time_date(v) = datetime(time{v}, 'InputFormat', 'yyyy-MM-ddHH:mm:ss');
v = v + 1;
end
Id = DHI;
Ib = DNI;
pg = data.SurfaceAlbedo;
delta = zeros(365,1);
v = 1;
for n = 1:365
delta(n) = 23.45*sind(360 *(284 + n)/365); % delta angle for each day
for h = 1:24
I0(v) = 1367*(1 + 0.033*cosd(360*n/365))*(cosd(phi)*cosd(delta(n))*cosd(omega(v)) + sind(phi)*sind(delta(n)));
Rb(v) = (sind(delta(n))*sind(phi-beta) + cosd(delta(n))*cosd(phi-beta))/thetaz(v);
kt(v) = Id(v)/I0(v);
It(v) = Ib(v)*Rb(v) + Id(v)*(1+cosd(beta))/2 + Ib(v)*pg(v)*(1-cosd(beta))/2;
v = v + 1;
end
end
figure
subplot(2,1,1)
x = time_date(1:24*31);
plot(x, Ib(1:24*31), '-k.', 'linewidth', 1.5, 'markersize', 10), hold on
plot(x,It(1:24*31), 'r', 'linewidth', 2)
xlabel('Date/Time')
ylabel('{Solar Radiation (W/m^{2})}')
legend('Inclined', 'Horizontal')
title('January')
grid on
xtickangle(90)
xtickformat('MM/ddHH:mm:ss')
subplot(2,1,2)
x = time_date(181*24+1:181*24+31*24);
plot(x, Ib(181*24+1:181*24+31*24), '-k.', 'linewidth', 1.5, 'markersize', 10), hold on
plot(x,It(181*24+1:181*24+31*24), 'r', 'linewidth', 2)
xlabel('Date/Time')
ylabel('{Solar Radiation (W/m^{2})}')
legend('Inclined', 'Horizontal')
title('July')
grid on
xtickangle(90)
xtickformat('MM/ddHH:mm:ss')
% newLim = get(gca, 'XLim');
% newx = linspace(newLim(1), newLim(2), 30);
% set(gca,'XTick', newx);
% datetick(gca,'x','MM/ddHH:mm:ss','keepticks');